The key operating indicator in the case of the PGE Group is the volume of energy produced and its structure. In terms of margins, it is especially important to point out the production from the Group’s own fuel, i.e. lignite. The production structure mainly depends on the availability of assets, i.e. on the generation unit overhaul schedule.
In 2019, the lignite production volume amounted to 32.2 TWh of electricity. The second most important fuel for the PGE Group is hard coal, from which we produced 18.94 TWh. The decrease in volume resulted from lower domestic demand for electricity and raising import of energy.
We measure the production volume in two ways. Acc. to fuels and acc. to production units. Some of our units use multiple types of fuels (e.g. coal power plants feature co-combustion of small quantities of biomass as a supplementary fuel, therefore not all energy deriving from a coal power plant is produced from lignite).
The total RES production in the PGE Group amounted to 2.04 TWh and was 16% higher when compared to the prior year. The electricity production volume from renewable sources is estimated as total energy production from wind, water and higher combustion of biomass. (including co-combustion in conventional power plants). The higher energy production volume from RES was related to the better wind conditions and increase in biomass combustion. The electricity produced in pumped-storage power plants (ESP) is not classified as RES production (in fact, it constitutes storage).
Another important business activity, apart from electricity production, at the PGE Group is electricity distribution. In the past year, our grids delivered 36.38 TWh of electricity to almost 5.5 million power take-off points. Due to the increase in economic activity and GDP, the distribution volume has been stably increasing for years. In 2019, the distribution volume was unchanged in comparison to the previous year. The increase in demand also requires continuous investment in the distribution grid to meet the needs of recipients and the growing economy.
**CAGR – compound annual growth rate.
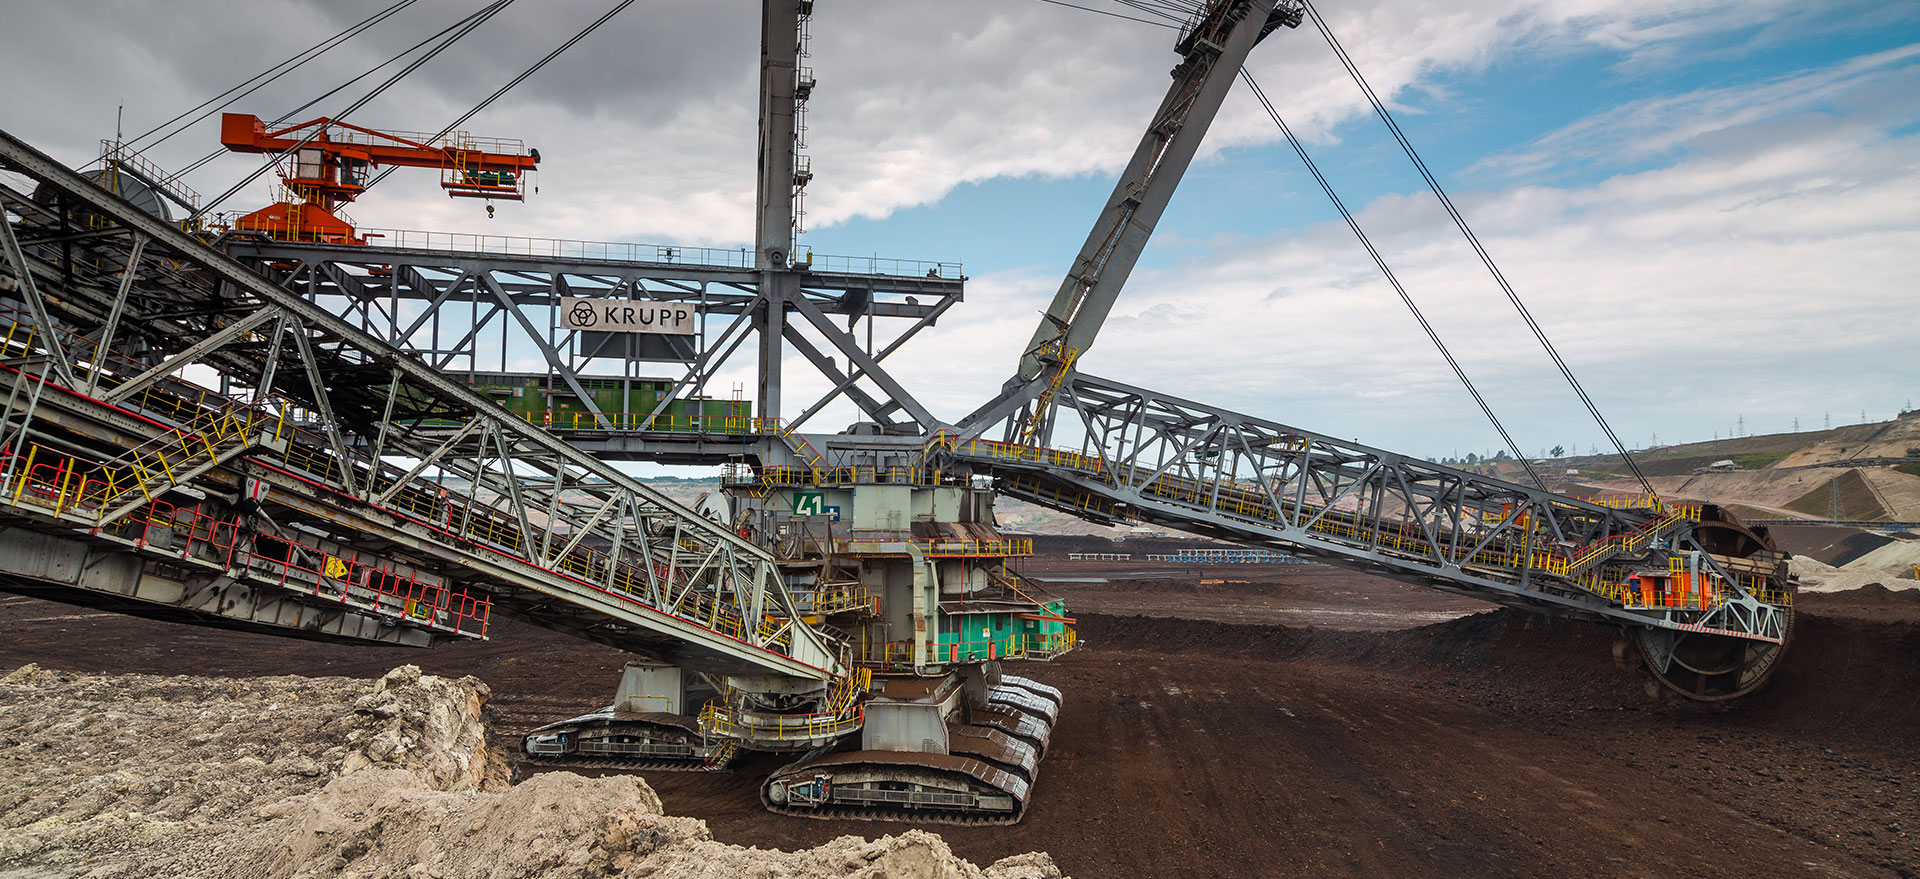
In 2019, a total of 43.3 million tons were mined (decline by 15% YOY). It is worth mentioning that the fuel production is strictly correlated with the electricity production volume in power plants for which mines constitute natural facilities.
The increase in the energy sales volume to final recipients by 3% YOY was mainly related to the growing number of clients.
In 2019, the PGE Group’s heat sales volume was up by 1% YOY in comparison to the year prior and for the first time exceeded 50 PJ. This is the result of takeover of PGE Energia Ciepła’s heating assets, i.e. heat and power plants in Kraków, Gdańsk, Gdynia, Wrocław, Zielona Góra, Czechnica, Toruń and Zawidawie.


